
Bang for Buck: India’s Defence Expenditure in Wider Perspective


 Summary: The study argues that India’s rising military expenditure and its improved ranking as the world’s third-largest military spender is largely due to a hefty increase in manpower cost. It juxtaposes India’s military expenditure with that of other major/relevant military spenders to gauge the pattern of expenditure including in relation to personnel and non-personnel expenditures. It also argues that while the current resource constraints facing the Indian defence establishment need to be addressed through an additional increase in allocations, the long-term sustainability of India’s military expenditure lies in addressing the bulging manpower cost. Any manpower reform, however, needs to take cognisance of India’s unique security requirements and the morale of the armed forces.
The 2019 military expenditure database of the Stockholm International Peace Research Institute (SIPRI), released in April 2020, ranks India third, behind the United States (US) and China, and ahead of Russia, France and the United Kingdom (UK) among other major defence spenders.1 The latest military spending ranking for the world’s fifth-largest economy is an improvement of one place over the previous year and a jump of six places since 2009.2 As per the SIPRI’s database, India’s military spending of $71.1 billion in 2019 amounts to 2.4 per cent of the country’s gross domestic product (GDP) and 3.7 per cent of the total global military spending of $1.9 trillion. The database also reveals that among the top-10 spenders, India had the highest real term (or inflation adjusted) increase of 30 per cent during 2014-19, followed by 25 per cent each for China and Germany (see Annex I). The US, which outspends the next 10 biggest military spenders combined, had seen a marginal increase of seven per cent during the same period.3 SIPRI attributes India’s latest rise in ranking to “tensions and rivalry with both Pakistan and China” among other major drivers.4 In the previous year’s assessment also, SIPRI had attributed rise in India’s military expenditure to the same major drivers.5
Is the SIPRI analysis correct? To what extent has the rivalry with Pakistan and China influenced India’s defence budget and in what manner? In other words, which segments of India’s military expenditure account for major increase? How does India’s military spending fare with that of other major spenders or countries relevant to India?
This study deals with these questions through an examination of defence expenditure of India and some relevant countries that include the US and its major North Atlantic Treaty Organisation (NATO) allies, and India’s two neighbours, Pakistan and China. In so doing, it examines the pattern of expenditure over a longer time period, wherever needed, and juxtaposes them with some other major/relevant military spenders. The pattern of expenditure is examined with a particular focus on personnel and non-personnel expenditures. The study, however, begins with a brief discussion on the definition of military expenditure, a terminology synonymously used as defence expenditure.
Military Expenditure: Definitional Aspects
Though the global military expenditure represents 2.2 per cent of the world output,6 there is no common and internationally acceptable definition of what constitutes defence or military expenditure. Ideally, any expenditure incurred on the military or external defence of a country should constitute as the defence expenditure. Simple as it may sound, governments, military alliances and think tanks differ significantly on the definitional aspects.
National governments often provide a narrow definition of defence expenditure for a variety of reasons. Such narrow definitions do not count all the monies spent on defence. For some, hiding true defence expenditure is part of a larger strategy to project a benign face to the outside world. Among the big spenders, China, in particular, is known to be in this group, as its official defence budget is widely believed to be underreported by a significant margin.7 For some others, it is a matter of accounting practice. For them, the expenditure which is accounted for by their defence departments/ministries is treated as defence expenditure. Countries like India and the UK fall into this category. Even for these countries, the entire amount spent through their defence ministries is not necessarily counted as official defence expenditure. For instance, it was a long-held convention for the Indian Ministry of Defence (MoD) to treat a part of its budget as official defence budget. Pensions and civil expenses of the MoD and affiliated organisations were outside the purview of official expenditure. In recent years, however, the MoD has started treating its entire budget as defence budget.8
The US is probably the only country which voluntarily includes a large part of expenditure outside the Department of Defense (DoD) in its larger military expenditure. Its military budget includes, besides the DoD’s allocations, the defence-related budgetary provisions earmarked for other federal agencies.9 Such voluntary disclosure on the part of the US notwithstanding, its actual military spending is even higher than what it reveals. A significant part of the US federal budget is spent on veterans’ wellbeing, particularly through the Department of Veterans Affairs.
In the absence of a common definition, military alliances and research institutions define defence expenditure to meet their own requirements. The definition followed by the NATO is meant to compare each alliance member’s efforts to “meet the needs of its armed forces, those of Allies and of the Alliance”.10 Additionally, the definition also enables each member’s compliance with the NATO guideline that requires each alliance member to spend at least two per cent of the GDP on defence and a minimum 20 per of defence budget on equipment purchase and research and development (R&D).11
The NATO definition covers more elements than the member countries usually include in their defence expenditure.12 The expenditures which countries generally do not treat as defence expenditure but subsumed in the NATO definition include expenses on other forces, such as coast guard, national police forces, gendarmerie, etc. which are often funded from other ministries.13 The NATO definition of defence expenditure is broadly grouped under four major categories: Personnel Expenditure (including civil and military pay and pension), Operations and Maintenance (O&M), Equipment, and Infrastructure (see note under Table 4).14 The NATO does not count war damage payments and expenses on civil defence as part of defence expenditure.
Somewhat similar to NATO definition is the definition used by the SIPRI, which along with the International Institute for Strategic Studies (IISS), compiles annual military expenditure statistics across a large number of countries. SIPRI’s database on military expenditure particularly stands out because of its definitional clarity, transparency in collection and reporting of data and global coverage. SIPRI includes both the current and capital expenditure on four major heads: “(a) the armed forces, including peacekeeping forces; (b) defence ministries and other government agencies engaged in defence projects; (c) paramilitary forces, when judged to be trained and equipped for military operations; and (d) military space activities.”15
Like NATO, SIPRI also excludes a few items of expenditure from the estimation of military expenditure. These include “Civil defence and current expenditures on previous military activities, such as veterans' benefits, demobilization, conversion and weapon destruction.”16 It is, however, important to note that in reality the definition used by SIPRI is not strictly applied uniformly across the countries to estimate military expenditure because of the paucity of country-specific relevant data.
The aforementioned discussion on the definitional aspects of military expenditure shows that military expenditure of various countries is not perfectly comparable as components of military expenditure of one country may not be the same as that of the others. For instance, Coast Guard is a part of the Indian MoD and hence part of the Indian defence expenditure.17 The Coast Guard of the US is part of the Department of Homeland Security and hence not part of the US military expenditure. Given the lack of uniform definition, international comparison of military expenditure or any of its components and sub-components, at best, provides a broad indication of resources devoted to defence by a country. For the same reason, it is far more logical to compare military expenditure and its various components of any given country over a period of time, so as to ascertain any particular trend or issue.
India’s Defence Expenditure
The size of India’s defence expenditure varies depending on which definition one follows. Traditionally, a part of the MoD’s budget, which is reflected in the Defence Services Estimates (DSE) – an annual publication of the MoD that primarily deals with the expense of the armed forces and the MoD-owned research and production agencies – was treated as India’s defence budget. In recent years, however, the MoD has taken a broader approach to the defence expenditure. As mentioned earlier, the recent definition covers the entire budget of the MoD, which includes, besides the allocations provided for in the DSE, the expenditures on account of defence pension and MoD (Civil). The latter include the MoD’s secretariat expenses and expenses of organisations such as the Coast Guard, Border Roads Organisation (BRO), Defence Accounts Department (DAD) and the Defence Estate Organisation, among others.
It is important to note that even the recent definition does not capture some of the defence-related expenditures which are incurred outside the MoD’s budget. Among all the expenditures incurred outside the MoD, there is no publicly available information on India’s strategic programmes carried out by other government agencies. Information is also in short supply about the defence-specific intelligence expenditure incurred by non-MoD agencies. Last but not least, the tax forgone by the government on account of items sold through the Canteen Stores Department (CSD),18 and income tax exemptions on some allowances and certain retirement benefits are not in the public domain.19 In short, India’s actual defence expenditure is not what it looks from a narrow prism of the DSE or the MoD’s overall budget. Any discussion about the adequacy of resources or lack of it, therefore, needs to take cognisance of this hard fact.
A part of the defence expenditure outside the MoD’s budget, which is publicly available, is that of the Ministry of Home Affairs (MHA) under which function four border guarding forces (BGFs): the Border Security Force (BSF), the Indo-Tibetan Border Police (ITBP), the Assam Rifles (AR) and the Sashastra Seema Bal (SSB).20 If the expenditure of these four BGFs is added to the MoD’s budget, India’s defence expenditure, as per the wider definition, would amount to Rs 5,13,660 crore (US$ 67.7 billion) in 2020-21 rather than Rs 4,71,378 crore (see Table 1).
Definition |
Main Components | Amounts (Rs in Crore) | % of CGE | % of GDP |
| Conventional Definition | DSE: Armed Forces, OFB, DRDO | 3,23,053 | 10.62 | 1.44 |
| Recent Definition | MoD’s Budget: DSE, Defence Pension and MoD (Civil) | 4,71,378 | 15.49 | 2.10 |
| Wider Definition | MoD’s budget plus four border guarding forces | 5,13,660 | 16.88 | 2.28 |
Note. India’s defence expenditure as per the wider definition is close to SIPRI’s definition though SIPRI’s data is a little overestimated because of the inclusion of the Central Reserve Police Force (CRPF).21
Source: Table Compiled from “Union Budget 2020-21”, Ministry of Finance, Government of India.
As evident from Table 1, India’s defence expenditure as per the wider definition is 59 per cent higher than what is conventionally considered India’s defence budget and about 10 per cent higher than MoD’s total budget. As explained earlier, even the defence expenditure as per the wider definition is not a true reflection of the government’s commitment towards defence, as it does not take into account many items of expenditure related to defence, which are not available in the public domain.
In recent years, India’s defence expenditure has been characterised by the manpower cost-driven growth. As the Figure 1 shows, the share of Pay and Allowances (P&A) and Pension together has increased by 12 percentage points from 49 per cent to 61 per cent in a matter of a decade, with the share of pension alone jumping the most from 18 per cent to 28 per cent. The rise in the pension’s share has mostly come at the cost of capital acquisition and Stores. The latter mostly caters to the operational and maintenance expenditure of the armed forces.
To put the changing pattern of MoD’s expenditure in a perspective, it is worth analysing individual category’s contribution to the overall growth. Between 2011-12 and 2020-21, the MoD’s overall expenditure has increased by Rs 2,57,705 crore at a compound annual growth rate (CAGR) of 9.2 per cent. Of the total increase, 71 per cent (or Rs 1,83,905 crore) is due to the combined increase in P&A and Pension (the contribution of the Pension alone has been 37 per cent or Rs 96,256 crore). On the other hand, the capital acquisition has contributed 13 per cent (Rs 34,012 crore) to the overall increase, R&D four per cent (Rs 9,434 crore), Stores three per cent (Rs 8,329 crore) and others nine per cent (Rs 22,025 crore).
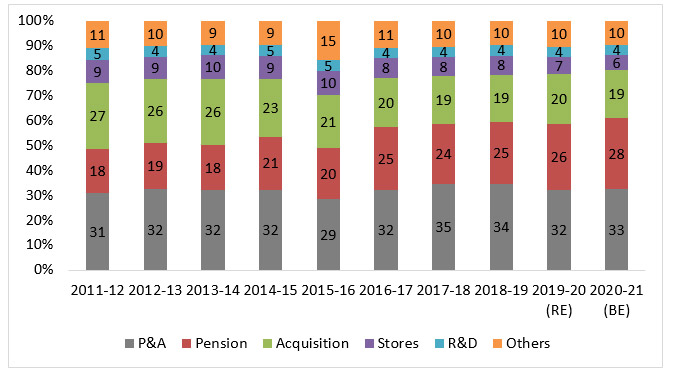
Note. Figures for 2019-20 and 2020-21 are revised and budget estimates, respectively. A sudden spike of ‘Other’ expenditure in 2015-16 is primarily due to temporary accounting change. The share of acquisition shown in the figure would be less if one views it from the strict sense of the term. For the past several years, the MoD has been booking some expenditures of revenue in nature to capital procurement account by using the CBRP. This has led to a somewhat artificial increase in acquisition spending.22
Source: Compiled from Defence Services Estimates (relevant years), Ministry of Defence, Government of India; and Union Budgets (relevant years), Ministry of Finance, Government of India.
So, the assessment of SIPRI that India’s rising defence expenditure and its improved ranking as a major military spender is majorly driven by tensions and rivalry with Pakistan and China is not entirely correct. Had it been the case, it would have been reflected in India’ changing military expenditure profile in the form of an increased share of procurement, stores and R&D, among other budget heads. As succinctly depicted in Figure 1, the major driver of India’s defence expenditure has been the manpower cost, particularly the pension, which is remotely connected with India’s current rivalry with Pakistan and China.
It is, however, important to note that the manpower cost as shown in Figure 1 is somewhat underestimated. The cost takes into account only two elements: P&A as broadly reflected in the DSE and the MoD’s pension expenditure. The P&A summary does not take cognisance of the full personnel-related cost of the MoD, partly because of the structure of the accounting system followed by it. A deeper look into India’s defence budget would reveal that nearly Rs 13,200 crore, which is a manpower-related expenditure, is not reflected in the MoD’s personnel expenditure. Some of them are discussed below:
- The P&A of the DSE does not include the salary paid to some of the big organisations such as the Coast Guard, BRO and the DAD. The salary of these organisations is provisioned in the MoD (Civil) budget. In 2020-21, the combined salary of these three organisations totalled Rs 5,216 crore.23
- While the DSE includes the P&A of Ex-Servicemen Contributory Health Scheme (ECHS) – which is meant for providing medical care to the retired uniformed personnel and their dependents24 – it does not include its other expenditures, particularly those related to medical treatment. For 2020-21, the ECHS has a budget of Rs 3,316 crore of which about Rs 3,000 crore is non-P&A.25
- The P&A summary of the DSE does not include certain provisions – such as the fresh ration, dry ration, milk and milk products, tinned ration and the like - which are provided through the Army Service Corps (ASC) Stores.26 In 2020-21, total provisions for the army, navy and the air force through the ASC stores amount to Rs 4,000 crore.27
- Like the provisions, the P&A summary of the DSE does not include expenditures incurred on the purchase of drugs, medical and dental equipment, among others. These expenses are provided through medical stores. The total amount earmarked for this is about Rs 1,000 crore in 2020-21.28
- The DSE does not also fully reflect the P&A of the Military Engineer Services (MES), an organisation with a manpower strength of over 60,00029 and a budget of Rs 20,000 crore.30 A part of its salary and wages bill is included in the ‘Works’ and ‘Miscellaneous’ heads of the DSE’s revenue segment.31 However, since there is no readily available data on how much is paid through these two heads, it is difficult to estimate the precise P&A of the organisation.
If the salary bill and other manpower-related costs discussed in the above mentioned first four points are added to the P&A and Pension expenditure reflected in Figure 1, the total personnel-related expenditure amounts to 64 per cent of the MoD 2020-21 budget.
It is important to mention that outside the MoD’s budget, the four BGFs also have a significant portion of manpower cost. Such costs are in the nature of P&A, pension and medical expenses among other personnel-related expenses. In 2020-21, the four BGFs have a combined budget of nearly Rs 42,000 crore, of which the salary bill alone is Rs 33,500 crore. If this salary bill is added to the MoD’s larger manpower cost, the manpower cost of India’s defence expenditure as per the wider definition would be about 65 per cent.
The hefty rise in manpower cost and dwindling share of procurement, stores and R&D has led some to voice concerns on the sustainability of India’s defence modernisation, serviceability of existing arms in the inventory, infrastructure upgradation and viability of the Make in India initiative in defence manufacturing.32
To address the bulging manpower cost, Chief of Defence Staff (CDS) General Bipin Rawat has put forth the idea of increasing the retirement age of some categories of armed forces personnel to 58 years, so as to save on the pension cost.33 The Indian Army, which accounts for over 85 per cent of the total uniformed personnel of the three forces, is apparently toying with ‘Tour of Duty’ concept to reduce its pay and pensionary cost.34 The MoD has also taken certain concrete steps in recent years to reduce its salary budget. Following the recommendations of the Shekatkar Committee, it has decided to abolish 9,304 civilian posts in the MES.35 Besides, it has also taken a bold decision to corporatise the Ordnance Factory Board (OFB), which is likely to improve, among others, its labour productivity and save on the P&A front.
While the above initiatives, which are either being contemplated or taken, are meant to curb the rising manpower cost, the question that crops up here is: are they enough? Also, there is an associated question: what should be the right mix of manpower and non-manpower expenditure? Is there anything that the Indian defence establishment could learn from others, knowing fully well that the context of military spending of each country is not necessarily similar and India has to find its own right mix? It is in this context that the military expenditure of some major/relevant spenders has been examined below.
US Military Expenditure
Like India, the US also has its own definition of defence expenditure. Its official defence expenditure is defined by budget function 5036 which consists of three sub-functions: DOD’s military activities (sub-function 51), atomic energy defence activities (sub-function 53) and defence-related activities of the Central Intelligence Agency (CIA) and other federal agencies (sub-function 54). However, as mentioned earlier, the US official defence budget, though more comprehensive than the budgets of many other countries, does not include several items of expenditure which can be arguably considered part of the US’s larger defence-related expenditure. Table 2 provides an approximate estimate of the total defence budget as projected in the President’s budget for FY 2021.37
| Sl. No | Element | Amount ($ Billion) | % of Total |
| 1 | (51) DOD- Military | 716.17 | 67.7 |
| 2 | (53) Atomic Energy Defence Activities | 27.62 | 2.6 |
| 3 | (54) Defence Related Activities of CIA & Other Federal Agencies | 9.72 | 0.9 |
| 4 | Veterans Benefits & Services | 238.81 | 22.6 |
| 5 | Net Retirement Benefit & Health Care# | 42.69 | 4.0 |
| 6 | Defence Related Tax Expenditure* | 22.91 | 2.2 |
| 7 | Total | 1057.91 | 100 |
Note. #: The net figure is arrived at by subtracting the DoD’s contribution from total cash outgo on account of benefits paid to avoid double counting. The net amount is distinct from the Department of Treasury’s annual contribution to the Military Retirement Fund (MRF) from which the pension is paid to the eligible military retirees. The Treasury’s said contribution is to meet the unfunded liability of the fund’s corpus and does not represent actual federal expenditure on military retirement in the year in which the contribution is made. *: Defence related tax expenditure is the total tax foregone by the US federal government due to various exemptions provided to the armed forces personnel and the veterans.
Source: Compiled from “President’s Budget FY 2021”, US Office of Management and Budget.
As can be seen from Table 2, the national defence budget (function 50) is about 71 per cent of what is US’s larger defence budget. The two big items of expenditure – veterans’ benefits and services, and retirement and health care benefits – are outside the official defence expenditure (function 50). The former is accounted for by the Department of Veterans Affairs, which provides compensation, pension and other benefits to some 19 million veterans.38 The retirement benefits, on the other hand, is provided from the Military Retirement Fund (MRF), which was created in the 1980s as part of the reforms undertaken to better manage future pensionary liabilities.39
It is, however, to be noted that the expenditure of the Department of Veterans Affairs ($185 billion in 2019) is not part of the military expenditure as per the definition followed by the US, SIPRI or the NATO. This is evident from Table 3, which shows the US military expenditure as per definitions followed by each one of them. The difference between the expenditure as per the US’s own definition and those of the SIPRI and NATO is apparently due to retirements benefits provided through the MRF. In the said year, the net cash outgo from the MRF was about $40 billion. Adding this amount to the amount defined as per budget function 50 takes the total to $726 billion, which is close to the estimation of both SIPRI and NATO.
Definition |
Amount ($ Billion) |
| US Defence Budget Function 50 | 686.003* |
| NATO | 730.149# |
| SIPRI | 731.751 |
Note. *: Actual Expenditure; #: Estimated figure
Source: “Data for all countries 1949–2019 (excel spreadsheet)”, SIPRI; “Defence Expenditure of NATO Countries (2013-2019)”, NATO, November 2019; and “Table 3.2—Outlays by Function and Subfunction: 1962–2025”, US Office of Management and Budget.
The US defence expenditure given its size and greater openness is a subject of great interest to many, with the annual SIPRI Yearbook often carrying a dedicated section on it. Figure 2 provides share of various components of the US defence outlays over the last 10 years. For the purpose of comparison, the US defence expenditure in Figure 2 includes three major elements: Outlays of the DoD and the Department of Veterans Affairs and the MRF. These three elements make up nearly 90 per cent of what the US intends to spend in FY 2021 (see Table 2). Suffice it to add that in the past 10 years, the US military expenditure, as represented in Figure 2, has increased by a CAGR of 2.5 per cent.
As Figure 2 illustrates, the manpower expenditure – comprising expenses on account of military personnel,40 Department of Veterans Affairs and the MRF, is the single largest item of expenditure, accounting for about 44 per cent of the total expenditure in 2021. Among the three, the expenditure of the Department of Veterans Affairs has increased by eight percentage points – in a somewhat similar pattern as that of India’s pension expenditure. Its increasing share has come mostly at the cost of O&M, whose share has declined by six percentage points. The procurement and research development, testing and evaluation (RDT&E) together have maintained their share, with minor aberrations in between. In other words, the rising share of personnel cost has not affected the US focus on modernisation and technological advancement.
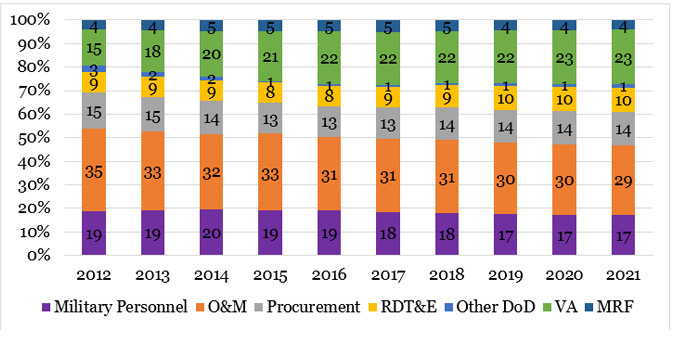
Note: Figures for 2020, 2021 are estimated outlays. VA stands for the Department of Veterans Affairs.
Source: Figure prepared from “Table 3.2—Outlays by Function and Subfunction: 1962–2025”; “Other Defense—Civil Programs”, US Office of Management and Budget; and “Valuation of Military Retirement System”, DoD Office of the Actuary.
NATO Defence Expenditure
As explained earlier, the NATO definition of defence expenditure is more comprehensive than the narrow definition followed by individual alliance members. Since all the member countries are required to follow a standard definition for reporting of their defence expenditure, it also provides an easy comparison of the pattern of expenditure among various countries. Table 4 summaries category-wise distribution of defence expenditure of the 10 largest NATO military spenders. As it is amply evident from the Table, the personnel expenditure is by far the single largest item of expenditure for all countries except the UK. Among the top-10 NATO spenders, except for Italy and Spain, the personnel expenditure, in case of each of the other countries, is less than 50 per cent, with the UK and the US leading the table with less than 40 per cent of their respective budgets being spent on manpower cost. There is no clear pattern for the next two big items of expenditure – Equipment and O&M. In four out of the 10 countries, Equipment expenses are higher than O&M expenses. Or in six countries, the share of O&M is higher than that of equipment.
Country |
Defence Expenditure (in Current US$ Billions) |
Share of Personnel (%) | Share of Equipment (%) | Share of Operations and Maintenance (%) | Share of Infrastructure (%) |
| US | 730.149 | 38.62 | 27.51 | 32.59 | 1.27 |
| UK | 60.761 | 34.52 | 22.35 | 40.95 | 2.17 |
| Germany | 54.751 | 44.02 | 16.55 | 35.61 | 3.82 |
| France | 50.729 | 45.78 | 24.45 | 26.65 | 3.12 |
| Italy | 24.482 | 65.66* | 20.57 | 11.30* | 1.92* |
| Canada | 22.485 | 49.40 | 13.34 | 33.81 | 3.45 |
| Turkey | 13.919 | 46.75 | 38.60 | 12.61 | 2.04 |
| Spain | 13.156 | 60.80 | 20.72 | 17.39 | 1.10 |
| Netherlands | 12.478 | 45.25 | 22.98 | 28.58 | 3.19 |
| Poland | 11.902 | 48.47 | 24.01 | 22.17 | 5.35 |
Note. *: Figure for 2018; Personnel expenditure includes military and civilian expenditure and pensions; Equipment expenditure includes major equipment expenditure and R&D devoted to major equipment; Operations and maintenance expenditure is inclusive of R&D expenditure and expenditure not allocated among other categories.
Source: “Defence Expenditure of NATO Countries (2013-2019)”, NATO, November 2019.
Military Expenditures of Pakistan and China
Because of the traditional hostilities, the defence expenditure of Pakistan and China is of paramount importance for the Indian defence establishment. The defence expenditure of both these countries are, however, not transparent, making it rather difficult to assess the magnitude of resources devoted by these countries to their defence as well as their broad classifications.
In the case of Pakistan, expenditures relating to major acquisitions and nuclear weapons programme are reportedly not part of the official defence budget.41 The expenditure on paramilitary forces such as the Pakistani Rangers, Frontier Corps, Coast Guard, etc., are also outside the official defence budget.42 Also excluded from the official defence budget is the military assistance that Pakistan gets from the US and others.43
Like Pakistan, Chinese official defence budget also does not include several items of expenditure related to defence and security. SIPRI, in its estimation of Beijing’s military expenditure, adds a number of items which are funded outside the Chinese official defence budget. These include:
(a) spending on the paramilitary People's Armed Police (PAP); (b) soldiers' demobilisation and retirement payments from the Ministry of Civil Affairs; (c) subsidies to the arms industry; (d) additional military research, development, testing and evaluation (RDT&E) funding outside the national defence budget; (e) additional military construction expenses; (f) arms imports; and (g) residual military-owned enterprises.44
Between Pakistan and China, the former provides somewhat broader details of what it projects as its official defence spending. Table 5 provides the expenditure details of the three major elements of its official spending for the last 10 years: Defence Affairs and Services, Pension, and Defence Production Division. As can be seen, Pakistan’s defence budget has grown quite handsomely from Pakistani Rupee (PKR) 0.53 trillion to PKR 1.76 trillion at a CAGR of 14.2 per cent. Its latest budget amounts to 25 per cent of the total federal outlays and 3.86 per cent of the GDP.
| Defence Affairs and Services (PKR Million) | Pension (PKR Million) | Defence Production Division (PKR Million) | Total (PKR Million) | Total ($ Billion) | |
| 2010-11 | 442,173 | 90,680 | 1,230 | 534,083 | 6.2 |
| 2011-12 | 495,215 | 96,138 | 1,455 | 592,808 | 6.6 |
| 2012-13 | 545,386 | 129,067 | 2,000 | 676,453 | 7.0 |
| 2013-14 | 627,226 | 171,263 | 2,300 | 800,789 | 7.8 |
| 2014-15 | 700,148 | 215,000 | 937 | 916,085 | 9.0 |
| 2015-16 | 781,162 | 231,000 | 900 | 1,013,062 | 9.7 |
| 2016-17 | 860,169 | 245,000 | 2,300 | 1,107,469 | 10.6 |
| 2017-18 | 920,166 | 248,000 | 4,468 | 1,172,634 | 10.7 |
| 2018-19 | 1,100,334 | 342,000 | 2,810 | 1,445,144 | 10.6 |
| 2019-20 | 1,152,535 | 421,000 | 1,700 | 1,575,235 | 10.1 |
| 2020-21 | 1,289,134 | 470,000 | 1,579 | 1,760,713 | 10.7 |
Note: Figures for all years are budget estimate. Conversion to US$ is based on Pakistan’s official exchange rate.
Source: Table compiled from “Federal Budget” (relevant years), Finance Division, Government of Pakistan.
Among the major elements of Pakistan’s official defence budget of 2020-21, Defence Services accounts for over 73 per cent of its total official spending, Pension 27 per cent and Defence Production 0.1 per cent. Interesting to note that unlike India, Pakistan’s defence pension expenditure is provided in two different categories: military and civilian. The ratio is 80:20 in 2020-21.45 In the last 10 years, the pension budget has increased substantially, from 17 per cent to 27 per cent of the total official defence budget, in a pattern somewhat similar to the rise in pension expenditure in India and the US.
The budget head Defence Services, which primarily caters to the Pakistan armed forces, consists of four categories: employees related expense, operating expense, and expenses on account of physical assets and civil works. Figure 3 summarises trends of their respective shares over the past 10 years. While the shares of employees cost and operating expenses have declined, the shares of physical assets and civil works have increased. If the shares of employees related expenses and pension are added, the personnel cost amounts to 54 per cent of its total defence budget in 2020-21, up from 50 per cent in 2010-11. The personnel cost is, however, exclusive of other personnel-related costs that are associated with other budget heads (such as the defence affairs and defence production division) of Pakistan official defence budget.

Note: Figures for all years are budget estimate.
Source: Figure compiled from “Federal Budget” (relevant years), Finance Division, Government of Pakistan.
Compared to Pakistan, China has a much larger defence budget. Its official defence budget for 2020 is projected at $179 billion, which represents 1.6 per cent of its GDP.46 Considering that its actual military expenditure is as high as 1.5 times its official budget, its actual military expenditure could be $270 billion, which makes it nearly four times bigger than India’s defence expenditure as per the wider definition under discussion in the study.47
Beijing does not provide regular updates on the classification of its defence budget. It, nonetheless, reports its military expenditure to the United Nations Office for Disarmament Affairs (UNODA). As per its 2017 submission (the latest so far), China’s official defence expenditure is distributed among three categories, with the Equipment accounting for over 41 per cent, followed by Personnel (31 per cent) and Training and Maintenance (28 per cent) (see Table 6). Though this pattern of spending may not necessarily hold true for its larger actual military expenditure, it does provide a broad indication of China’s defence budget priority in so far as resource distribution is concerned.
Category |
Active Forces | Reserve Forces | Militia & Others | Total | |
| Amount | % | ||||
| Personnel | 317,841 | 3,211 | - | 321,052 | 30.8 |
| Training & Maintenance | 268,639 | 4,653 | 20,058 | 293,350 | 28.1 |
| Equipment | 424,270 | 4,286 | 279 | 428,835 | 41.1 |
| Total | 1,010,750 | 12,150 | 20,337 | 1,043,237 | 100 |
Note: Personnel expenses cover salaries, allowances, food, clothing and bedding, insurance, welfare benefits and pensions for officers, non-ranking officers, enlisted men, contracted civilians, and retired officers supported by the military. Training & Maintenance expenses cover training, institutional education, construction and maintenance of installations and facilities, and other expenses on routine consumables. Equipment expenses cover research and experiment, procurement, maintenance, transportation and storage of weaponry and equipment.
Source: “China”, United Nations Office for Disarmament Affairs.
Summing Up
From the above discussion, it is apparent that the manpower cost as a percentage of military expenditure remains high for most of the selected countries taken up for this study. It is also apparent that India’s manpower cost in relation to most others is on a much higher side. Although this cross-country comparison needs to be read with caution due to the different contexts of military spending for each country and lack of perfectly comparable data, it points to the broader question of Indian MoD’s compulsions and constraints in resource allocation, viability of defence modernisation, operational preparedness, and Make in India in defence sector and, above all, the sustainability of defence spending.
It is an understatement to say that the present level of India’s defence spending is inadequate. The inadequacy is such that the MoD, for the last several years, is finding it increasingly difficult to service its past commitments. In 2020-21, the MoD’s overall shortage of resources is nearly Rs 1,03,000 crore,48 a majority of which are in the capital expenditure, which caters to the modernisation of the defence forces, infrastructure creation/upgradation and Make in India in defence.
Considering that defence preparedness is of the highest priority, there is a need to augment defence spending in the short to medium term. This could be done either through the additional mobilisation of resources (preferably the tax revenue) or through higher deficit financing and/or squeezing resources meant for development. Any substantial increase in the budget in the long-term, however, needs to be fiscally prudent, so as to avoid ramifications on the wider economy.
It may be noted that unlike many other countries, India’s resource base is rather limited. India’s tax-to-GDP ratio, an indicator of the soundness of public finance and a key determinant as to how much the government could spend, is about 17 per cent, whereas the average ratio is over 21 per cent for the Emerging Market Economies (EMEs) and as high as 34 per cent for the Organisation of Economic Co-operation and Development (OECD) countries.49 To put the ratio in perspective, one per cent of India’s estimated GDP for 2020-21 amounts to nearly Rs 2,25,000 crore, which is more than twice the current year’s shortages facing the MoD.
Given the limited resource base and various competing demands, particularly from the socio-economic sectors, the MoD needs to work on a plan to optimise its allocated resources, rather than hoping to bridge its entire resource gap through additional funding from the Ministry of Finance. One area that requires greater focus is the manpower cost which has so far received scant attention, even though a plethora of committees and commissions in the past have suggested a number of measures to contain the manpower cost, including the pensionary charges.
Any reform of defence manpower, however, has to be sensitive to the country’s unique defence and security requirements as well as the morale of the armed forces who risk their lives in defending the country. While it is true that given India’s vast unsettled borders, the manpower cost will remain a big item of defence expenditure, it is also a fact that the rise in manpower cost has come at a significant cost to modernisation and O&M. Regardless of the correspondence between India and some other countries with regard to personnel–non-personnel cost ratio, India has to find its own way of rationalising the manpower cost in a manner that would allow greater resource allocation particularly on modernisation, stores and R&D, etc. This assumes greater significance in view of technology-intensive modern warfare, competing demands from socio-economic sectors and less-than-desired growth in overall defence spending. Needless to reiterate, rationalising the manpower cost will go a long way in improving the combat capability of the defence forces and help obtain the proverbial bang for the buck.
| Rank | Country | Defence Expenditure (In US$ Billion) | % Share of Defence Expenditure in GDP | World Share (%) | % Change in 2015-19* |
| 1 | US | 731.8 | 3.4 | 38 | 7 |
| 2 | China | [261.1] | [1.9] | [14] | 25 |
| 3 | India | 71.1 | 2.4 | 3.7 | 30 |
| 4 | Russia | 65.1 | 3.9 | 3.4 | -13 |
| 5 | Saudi Arabia | [61.9] | [8.0] | [3.2] | -31 |
| 6 | France | 50.1 | 1.9 | 2.6 | 4.3 |
| 7 | Germany | 49.3 | 1.3 | 2.6 | 25 |
| 8 | UK | 48.7 | 1.7 | 2.5 | 0.2 |
| 9 | Japan | 47.6 | 0.9 | 2.5 | -0.5 |
| 10 | South Korea | 43.9 | 2.7 | 2.3 | 18 |
| 24 | Pakistan | 10.3 | 4.0 | 0.5 | 29 |
Note. Figures in [ ] are estimates; *: Changes are in real terms, based on constant (2018) US$.
Source: Table compiled from “SIPRI Military Expenditure Database”, SIPRI.
Views expressed are of the authors' and do not necessarily reflect the views of the Manohar Parrikar IDSA or of the Government of India.
- 1. “Global military expenditure sees largest annual increase in a decade—says SIPRI—reaching $1917 billion in 2019”, SIPRI, April 27, 2020; Nan Tian, Alexandra Kuimova, et al., “Trends in World Military Expenditure, 2019”, SIPRI Fact Sheet, April 2020. The ranking of military spenders needs to be read with caution as it could be influenced by volatility in the dollar exchange rate with which military spending of various countries is compared. An adverse (favourable) exchange rate could lower (increase) ones’ military spending in dollar terms even if that country’s expenditure in domestic currency has increased (decreased).
- 2. “World Economic Outlook Database”, International Monetary Fund, October 2019. For past ranking of major military spenders, see SIPRI Yearbooks (relevant years).
- 3. Nan Tian, no.1.
- 4. SIPRI, no. 1. For time series data, see “SIPRI Military Expenditure Database”, SIPRI.
- 5. Nan Tian, Aude Fleurant, et al., “Trends in Worlds Military Expenditure, 2018”, SIPRI Fact Sheet, April 2019.
- 6. SIPRI, no. 1.
- 7. For example, see “Military and Security Developments Involving the People’s Republic of China 2019”, Office of the Secretary of Defense, US Department of Defense, May 2019, p. 94.
- 8. For example, see “Decline in Defence Expenditure as a Part of GDP”, Rajya Sabha, Unstarred Question No. 1159, Answered on March 02, 2020. In response to the question in the Parliament, the written answer of the Minister of State for Defence was categorical in showing the entire MoD budget as the defence budget.
- 9. See “National Defense Budget Estimates for FY 2021”, Office of the Under Secretary of Defense (Comptroller), US Department of Defense, April 2020, p. 5.
- 10. “Defence Expenditure of NATO Countries (2013-19)”, NATO, November 2019, p. 15.
- 11. See “Wales Summit Declaration”, NATO, September 05, 2014.
- 12. In case of the UK, the difference in 2017-18 is about £6.4 billion between its NATO-compliant defence expenditure (£43.3 billion) and what it treats as its official defence expenditure (£36.9 billion). See “UK Defence Expenditure”, House of Commons Library; and NATO, no. 10.
- 13. For such other forces, the NATO definition requires members to include expenditure in “proportion to the forces that are trained in military tactics, are equipped as a military force, can operate under direct military authority in deployed operations, and can realistically be deployed outside national territory in support of military force.”
- 14. For the definition and components of defence expenditure, see NATO, no. 10.
- 15. “Sources and Methods”, SIPRI.
- 16. Ibid.
- 17. The Indian Coast Guard has a budget of Rs 5,033 crore in 2020-21.
- 18. The CSD’s annual sales turnover is estimated at nearly Rs 20,000 crore in 2020-21. As per the extant regulations, the government reimburses 50 per cent of the total goods and services tax (GST) levied on items sold. As a conservative estimate, tax reimbursement would be anywhere around Rs 1,000 crore.
- 19. For example, the in-service armed forces personnel are entitled to tax exemption on several monetary allowances [Rs 7,500 per month (pm) as Siachen Allowance, Rs 4,200 pm as Highly Active Field Area Allowance, Rs 3,900 pm as Counter Insurgency Allowance, etc.] and gallantry award benefits. For retirees, income tax is fully exempted on pension payable to gallantry awardees and disability pension.
- 20. Of the four BGFs, AR is under the operational control of the Indian Army.
- 21. SIPRI’s figure for India’s military expenditure for 2019-20 is Rs 5,13,795 crore, which is close to sum of revised allocations provided for under the DSE, Pension, MoD (Civil), Indo-Tibetan Border Police (ITBP), Assam Rifles (AR), Sashastra Seema Bal (SSB), and the Central Reserve Police Force (CRPF).
- 22. For an analysis of the CBRP and its impact on procurement budget, see Vinay Kaushal, “Should the Legacy of Capital Budget Revenue Procedure (CBRP) Be Perpetuated in Draft DPP 2020?”, MP-IDSA Issue Brief, April 10, 2020.
- 23. Compiled from “Detailed Demands for Grants of the Ministry of Defence for 2020-21”, Government of India.
- 24. The ECHS, based on one-time contribution from the beneficiaries, is applicable for life.
- 25. “Defence Services Estimates 2020-21”, Ministry of Defence, Government of India, pp. 26, 112.
- 26. Armed forces personnel are entitled to free ration in kind. The ration is generally provisioned through the Army Service Corps (ASC) stores. Where ration in kind cannot be issued, cash is provided instead as part of the monthly salary.
- 27. “Defence Services Estimates 2020-21”, no. 25.
- 28. Amount inclusive of veterinary stores for the Army.
- 29. The manpower relates to civilians only.
- 30. “Annual Report 2018-19”, Ministry of Defence, Government of India, p. 114.
- 31. For example, see “Defence Services Estimates 2018-19”, Ministry of Defence, Government of India, p. 3.
- 32. For a review of manpower cost growth and possible options to address it, see Laxman Kumar Behera, “India’s Defence Budget 20-21”, MP-IDSA Issue Brief, February 04, 2020; Laxman Kumar Behera and Vinay Kaushal, “Defence Pension Reforms: Recommendations of the Past Committees and Commissions”, MP-IDSA Special Feature, February 28, 2020; and Laxman Kumar Behera, Vinay Kaushal & Amit Cowshish, “Defence Pension: A Comparative Study of India, US and UK”, MP-IDSA Policy Brief, April 23, 2020.
- 33. Shishir Gupta, “General Rawat favours pension cost cut, colonial bungalows to go away”, Hindustan Times, February 10, 2020.
- 34. The concept is intended to recruit civilians for a short three-year tenure in the Army’s officer and non-officer cadres. See Dinakar Peri, “Army proposes 3-year stint for civilians”, The Hindu, May 14, 2020. For a critical analysis of the Tour of the Duty concept, see H.S. Panag, “Army’s Tour of Duty ill-conceived. Neo-nationalism will only create political militias”, The Print, May 21, 2020.
- 35. “Raksha Mantri Shri Rajnath Singh approves abolition of 9,304 posts in Military Engineering Service”, Press Information Bureau, Government of India, May 07, 2020.
- 36. The US federal budget is distributed into nearly 20 budget functions, with each function comprising “all spending for a given topic, regardless of the federal agency that oversees the individual federal program.” See “Budget Functions”, Committee on the Budget, US House of Representatives.
- 37. The composition of Table 2 for the purpose of estimating the US military expenditure is largely based on Todd Harrison and Seamus P. Daniels, “Analysis of the FY 2020 Defense Budget and Its Implications for FY 2021 and Beyond”, Centre for Strategic and International Studies, February 06, 2020, p. 3.
- 38. Of the total $202 billion that the Department of Veterans Affairs spent on 19 million veterans in FY 2019, 48 per cent ($98 billion) was spent on Compensation and Pension, 38 per cent ($78 billion) on Medical Care, seven per cent ($14 billion) on Education & Vocational Rehabilitation/ Employment, and the remaining seven per cent on other items. See “Expenditure Table”, US Department of Veterans Affairs.
- 39. William M. Hix and William W. Taylor, “Funding Military Requirements”, Rand Research Brief, 1997.
- 40. Military personnel expenditure as represented in Figure 2 is distinct from the military pay and benefits costs as defined by the US Department of Defense. The latter include military and civilian personnel pay and allowances, health, education and housing expenditure, among other cost items. For example, see “Fiscal Year 2018 Budget Request”, Office of the Under Secretary of Defence (Comptroller), US Department of Defence, May 2017, p. 5-2.
- 41. Baquir Sajjad Syed, “Govt proposes Rs1.29tr for defence spending”, Dawn, June 13, 2020.
- 42. According to Ayesha Siddiqa, a noted scholar on Pakistani military affairs, Pakistan’s military expenditure should include, in addition to defence affairs and services, defence pension, public services development programme (PSDP) on defence division and defence production division, nuclear regulatory authority, machine tool factory, coast guard, rangers, civilian armed forces, frontier constabulary, national security division, a part of the economic affairs division and a hefty sum of PKR 12-15 billion given as a discount to military-run companies. Siddiqa also believes that half of the expenditure of the Pakistan Atomic Energy Commission (PAEC) should be counted as part of Pakistan’s military expenditure. Based on the author’s correspondence with Siddiqa.
- 43. Between 2018 and 2020, Pakistan received foreign military assistance (FMA) worth $80 million from the US. “The Military Balance 2020”, International Institute of Strategic Studies, p. 299.
- 44. SIPRI, no. 15.
- 45. In the absence of any Indian official data on the distribution of defence pension between civilian and military pensioners, some have ventured to suggest that civilian defence pensioners make up about 40-42 per cent of the total defence pension disbursement, though their share in the total number of defence pensioners is 22 per cent. The suggestion is probably premised on the fact that unlike the relatively early retirement age for the armed forces personnel, the civilians retire at the age of 60 and have a higher reckonable pay on the basis of which pension is calculated and disbursed. See Prakash Katoch, “The Truth about Rising Defence Pension”, Indian Defence Review, February 19, 2020. Such a suggestion does not, however, take into account some key facts. Unlike the civilians, all uniformed personnel up to and inclusive of Brigadier and equivalent rank get an additional pay in the form of military service pay (MSP), which is Rs 15,500 for officers and Rs 5,200 for others, as part of their monthly pay. The MSP forms part of reckonable emoluments for calculating basic pension and dearness relief, and is an offsetting factor in so far as ‘advantage’ to the civilian pensioners is concerned.
- 46. “China further lowers defense budget growth to 6.6 pct”, Xinhua, May 22, 2020.
- 47. China’s estimated GDP for 2020 is nearly five times bigger than India’s. See “World Economic Outlook Database, October 2019”, International Monetary Fund.
- 48. “Demands for Grants 2020-21”, Standing Committee on Defence, Seventeenth Lok Sabha, Fifth Report, Lok Sabha Secretariat, March 2020, pp. 9-10.
- 49. “Economic Survey 2015-16, Vol. I”, Ministry of Finance, Government of India, p. 108.