
You are here
Defence Budget 2023–24: Trend Analysis


Summary
In the Union Budget 2023–24, of the four demands relating to the Ministry of Defence (MoD), allocations towards Defence Services (Revenue) constitute 45.5 per cent, Capital Outlay on Defence Services constitute 27.4 per cent, Defence Pensions 23 per cent while MoD (Civil) stands at nearly 4 per cent of the total MoD allocations. Defence budget as a percentage of Central Government Expenditure (CGE) has witnessed a steady decline from nearly 13 per cent in 2012–13 to 9.6 per cent in 2021–22.
In the Union Budget 2023–24, presented to Parliament by Finance Minister Nirmala Sitharaman on 1 February 2023, the allocations for the Ministry of Defence (MoD) amounted to Rs 5,93,537.64 crores, which represented an increase of 13 per cent over BE 2022–23 (Rs 5,25,166.15 crores).1 Demand No. 19, MoD (Civil) saw an increase of 12.5 per cent, from Rs 20,100 crores to Rs 22,612.5 crores; Demand No. 20, Defence Services (Revenue) saw an increase of 15.9 per cent, from Rs 2,33,000.54 crores to Rs 2,70,120.14 crores; Demand No. 21, Capital Outlay on Defence Services saw an increase of 6.7 per cent from Rs 1,52,369.61 crores to Rs 1,62,600 crores, while Demand No. 22 Defence Pensions saw an increase of 15.4 per cent from Rs 1,19,696 crores to Rs 1,38,205 crores. Defence Services (Revenue) and Defence Pensions, therefore, have seen an increase which is more than double the increase in capital outlay.
Defence Services (Revenue) constitutes 45.5 per cent, while Capital Outlay on Defence Services constitutes 27.4 per cent of the total allocations. Defence Pensions make up 23.28 per cent, while MoD (Civil) stands at 3.8 per cent of the allocations. The percentage share of Capital Outlay in BE 2022–23 though was higher at 29.01 per cent of the total allocations. Defence Services (Revenue) stood at 44.3 per cent, Defence Pensions at 22.8 per cent and MoD (Civil) at 3.8 per cent of the BE 2022–23 allocations.
|
|
MoD Civil |
Defence Services Revenue |
Capital Outlay on Defence Services |
Defence Pensions |
Total Defence Budget |
|
2022–2023 (BE) |
20,100 |
2,33,000.54 |
1,52,369.61 |
1,19,696 |
5,25,166.15 |
|
2023–2024 (BE) |
22,612.5 |
2,70,120.14 |
1,62,600 |
1,38,205 |
5,93,537.64 |
Source: Union Budget, 2023–24 and 2022–23, Ministry of Finance, Government of India.
Defence Services (Revenue) and Capital Outlay on Defence Services are usually taken as constituting defence budget. As a percentage of Central Government Expenditure (CGE), the 2023–24 (BE) allocations to these two demands made up 9.6 per cent of the CGE. Defence budget—Defence Services (Revenue) and Capital Outlay, as a percentage of CGE, has witnessed a steady decline in the past decade, from nearly 13 per cent in 2012–13 to 9.6 per cent in 2021–22 (Graph 1).
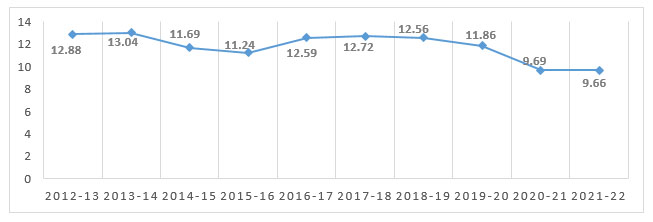
Source: Based on data from Union Budget, Ministry of Finance, Government of India, Various Years.
Note: The trend analysis in this graph as well as subsequent graphs is based on nominal values as mentioned in the budget documents of corresponding years.
Revenue and Capital Budget Share
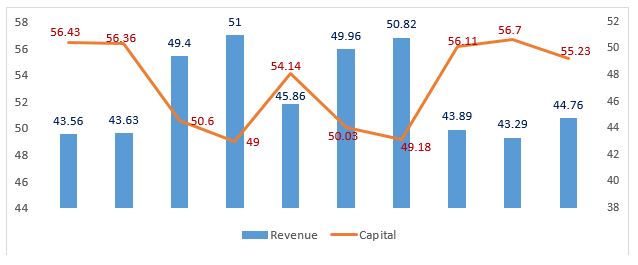
Graph 2 gives the breakdown of revenue and capital expenditure for the MoD, from 2014 to 2024. During the period 2016–20, revenue expenditure was over 72 per cent of the total allocations, and even exceeded 75 per cent in 2018–19. The capital share of the budget was over 29 per cent in 2014–15 and is estimated to be nearly 29 per cent in BE 2023–24. In 2018–19, it fell below 25 per cent as a percentage of total allocations.
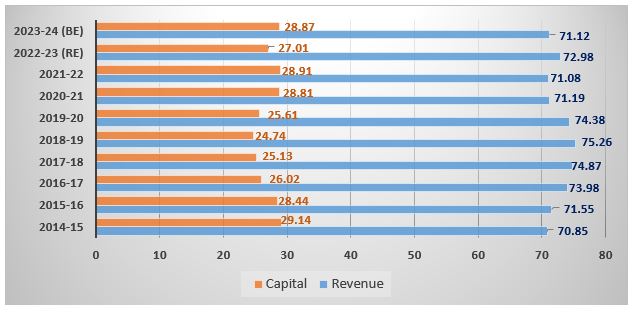
Source: Based on data from Union Budget, Ministry of Finance, Government of India, Various Years.
Note: For purposes of Graph 2, Revenue includes MoD (Civil Revenue), Defence Services (Revenue) and Defence Pensions. Capital includes MoD (Civil Capital) and Capital Outlay on Defence Services.
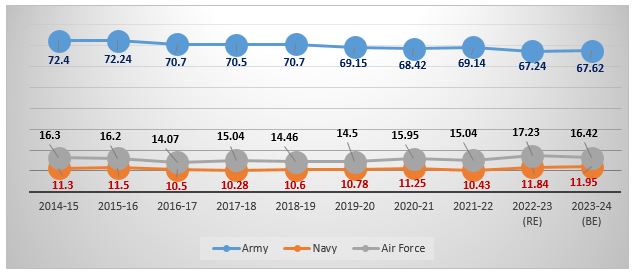
Graph 3 gives the Defence Services (Revenue) allocations for the individual services for the period 2014–24. The Army accounts for about 68 per cent of the MoD’s revenue budget in 2023–24 (BE), followed by the Air Force (at 17 per cent) and the Navy (at 12 per cent). The average annual share of the Army’s revenue budget since 2014 has been at around 70 per cent, while that of the Navy and the Air Force has been at 11 and 15.5 per cent, respectively.
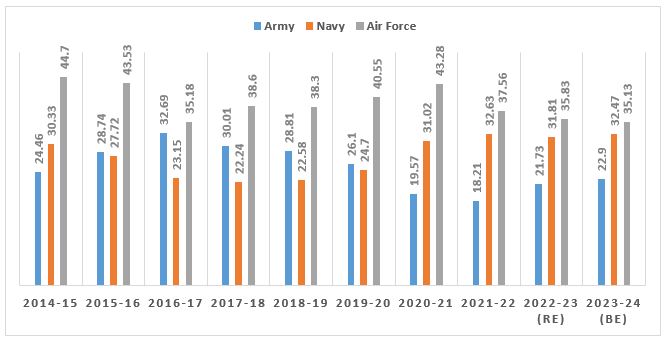
As for capital budget allocations for individual services, the Air Force leads the way with 35 per cent in 2023–24 (BE), followed by the Navy (at 32.5 per cent) and the Army (at 23 per cent) (Graph 4). The average annual share of the Air Force’s capital budget since 2014 has stood at about 39 per cent, while that of the Navy has been at 28 per cent and the Army has been at 25 per cent.
Modernisation Budget
In BE 2023–24, out of the capital outlay of Rs 37,214.54 crores to the Army, Rs 30,063 crores relates to what is termed as modernisation budget.2 As Graph 5 shows, the Army’s modernisation budget constitutes 18.48 per cent of the MoD’s capital outlay budget. While the Army’s modernisation budget as a percentage of MoD’s capital allocations reached a high of 25.69 per cent in 2016–17, it has seen an average annual growth rate of 20 per cent over the past 10 years, as against 36.8 per cent for the Air Force and 26.7 per cent for the Navy. In BE 2023–24, the Navy’s modernisation budget stood at Rs 49,353.75 crores while that of the Air Force stood at Rs 52,892.72 crores, about 30.35 and 32.52 per cent of the capital outlay budget respectively.
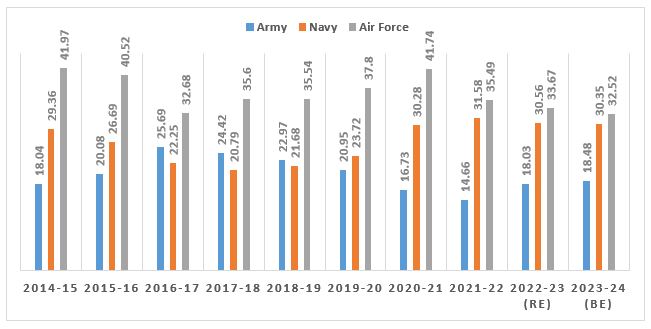
What is noteworthy is that the Army’s modernisation budget has seen a 48.6 per cent jump in 2023–24 (BE), as against 2021–22 (Actual), from Rs 20,231.11 crores to Rs 30,063 crores. The Navy’s modernisation budget has seen a 13.25 per cent increase, while that of the Air Force has seen an increase of around 8 per cent, during the corresponding time period.
Adequate funds for the modernisation purposes of the armed forces has been a long-running theme of debate. The MoD, in its submission to the 15th Finance Commission in August 2020, had projected a capital budget requirement of Rs 3,46,130 crores and had expected an estimated allocation of Rs 1,76,346 crores in 2023–24. The 2023–24 BE capital allocation at Rs 1,62,600 crore is less than that estimated allocation by Rs 13,746 crores.3
Salaries and Pension Budget
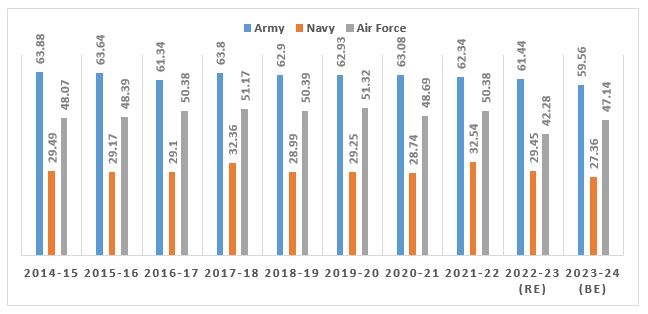
Pay and Allowances for the Army as a percentage of its revenue budget has decreased from nearly 64 per cent in 2014–15 to less than 60 per cent in 2023–24 (BE), even as the average annual percentage share of Pay and Allowances during this period has been at 62.5 per cent. For the Navy and the Air Force, the average annual percentage share of Pay and Allowances in their revenue budgets has stood at 30 and 49 per cent respectively. In 2023–24 (BE), the Pay and Allowances for the Army is estimated to be Rs 1,08,798.41 crores, while that of the Navy and the Air Force are estimated to be Rs 8,833.42 crores and Rs 20,907.48 crores respectively.
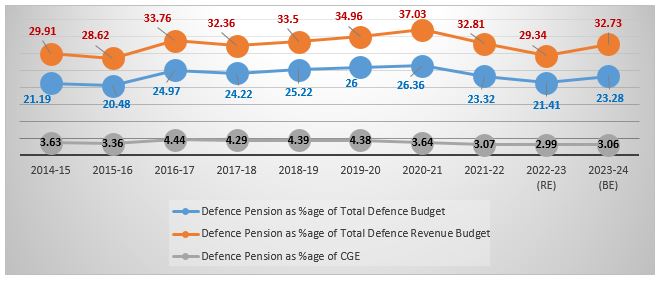
The MoD pension budget in 2023–24 (BE) meanwhile is estimated to be Rs 1,38,185 crores, which is 32.73 per cent of the total defence revenue budget (made up of MoD Civil Revenue+Defence Services Revenue+Defence Pensions), 23.28 per cent of the total MoD budget (MoD Civil+Defence Services Revenue+Defence Pensions) and 3 per cent of CGE. The average annual share of defence pensions in CGE since 2014 has stood at 3.7 per cent, while the pension budget as a percentage share of the total MoD allocations and as a percentage of total defence revenue budget since 2014 has been at 23.65 per cent and 32.5 per cent respectively.
Source: Based on data from Union Budget, Ministry of Finance, Government of India, Various Years.
Note 1: Total Revenue Budget includes MoD (Civil Revenue), Defence Services Revenue and Pension budget.
Note 2: Total Defence Budget includes MoD (Civil), Defence Services (Revenue), Capital Outlay on Defence Services and Defence Pensions.
As regards the individual services, the Army’s pension budget in 2023–24 (BE) is equivalent to 65.3 per cent of its revenue budget, while that of the Navy and the Air Force stand at 21 per cent and 27.3 per cent respectively. The Army’s pension bill has seen a cumulative annual growth rate (CAGR) of 8.17 per cent since 2014, rising from Rs 54,347.71 crores to Rs 1,19,300.45 in 2023–24 (BE). The Navy’s pension bill, meanwhile, witnessed a CAGR of 11.4 per cent during the same time period, as compared to 12.4 per cent for the Air Force.
Other Key Highlights
Border Security
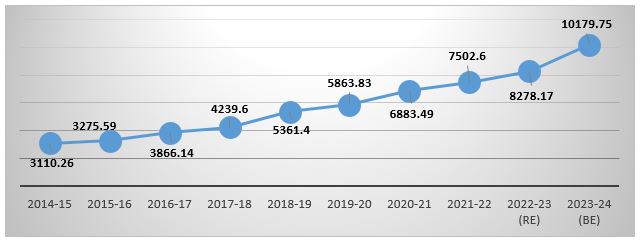
The allocations for border roads and infrastructure development at the borders has seen a significant jump in recent years, given the government’s focus on the subject. In 2023–24 (BE), an amount of Rs 6,005 crores has been allotted for capital works to be executed by the Border Roads Development Board (BRDB), while the establishment expenditure of the BRDB Secretariat is estimated to be Rs 4,174.75 crores. The overall money allotted to border roads development has increased from Rs 3,110.26 crores in 2014–15 to Rs 10,179.75 crores in 2023–24 (BE), representing a CAGR of 12.6 per cent.
As noted in earlier sections, the capital outlay on defence services has seen a CAGR of 8.27 per cent during the same time period (from Rs 73,401.04 crores to Rs 1,62,600 crores) while the modernisation budget of the three services has seen a CAGR of 7 per cent (from Rs 67,241.85 crores in 2014–15 to Rs 1,32,309.47 crores). This does show that border area development projects have seen a faster increase in budget allocations, to plug existing deficiencies.
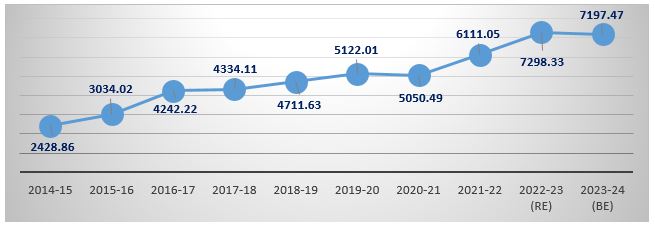
As regards maritime borders, the allocations to the Coast Guard in 2023–24 (BE) is to the tune of Rs 7,197.47 crores, as against Rs 2,428.86 crores in 2014–15. While the BE 2023–24 allocations represent an increase of 42.5 per cent over 2020–21 (Actual), it is 1.5 per cent less than the 2022–23 (BE) allocations. Even so, the allocations to the Coast Guard have seen a CAGR of 11.5 per cent since 2014–15.
Source: Based on data from Union Budget, Ministry of Finance, Government of India, Various Years.
Note: The data includes establishment expenditure of the BRDB as well as budget for capital works.
Source: Based on data from Union Budget, Ministry of Finance, Government of India, Various Years.
Note: The data includes revenue and capital expenditure of the Coast Guard.
Ex-Servicemen Contributory Health Scheme
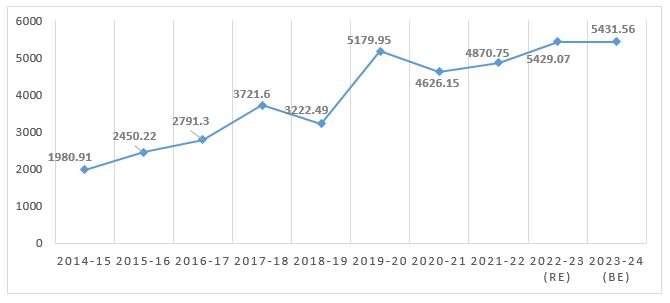
As the MoD highlighted in its press release on 1 February 2023, the defence budget allocations for the Ex-Servicemen Contributory Health Scheme (ECHS) stood at Rs 5,431.56 crores in 2023–24 (BE), as against Rs 3,582.51 crores in 2022–23 (BE), a jump of 51.6 per cent. The MoD notes that along with the allocations towards defence pensions, the massive jump in ECHS allocations is meant to ‘comprehensively raise the overall ease of living of our esteemed veterans’.4 From an allocation of Rs 1,980.91 crores in 2014–15 to the BE 2023–24 figures, the ECHS allocations have seen a CAGR of 10.6 per cent.
Agnipath Scheme
In 2023–24 (BE), the allocations for the Agnipath scheme for the three services is at Rs 4,266.14 crores, with the Army accounting for 89 per cent of the allocations. The 2023–24 (BE) allocations for Agnipath amount to 3.5 per cent of the Army’s Pay and Allowances budget, 3.39 per cent and 0.79 per cent of the Navy’s and Air Force’s Pay and Allowances budgets, respectively.
|
|
Army |
Navy |
Air Force |
|
2022–23 (RE) (in crores) |
350 |
80 |
23.4 |
|
2023–24 (BE) (in crores) |
3,800 |
300 |
166.14 |
Source: Union Budget 2023-24, Ministry of Finance, Government of India.
Research and Development
The capital outlay on research and development (R&D) for 2023–24 is estimated at Rs 12,850 crores, as against Rs 11,981.81 crores in 2022–23 (BE), an increase of 7.2 per cent. The revenue allocations increased by 11.4 per cent, from Rs 9,348.29 crores in 2022–23 (BE) to Rs 10,413.89 crores in 2023–24 (BE). The total allocations to the DRDO have therefore increased by 9.03 per cent.
The revenue budget for R&D has seen a CAGR of 6.07 per cent since 2014, while the capital budget has seen a CAGR of only 5.5 per cent. Capital budget for R&D went below 50 per cent of total outlay in 2020–21 and has since been increasing, accounting for over 55 per cent of the total R&D budget allocations in 2023–24 (BE).
The government has placed a premium on innovation-led economic growth. Series of steps have been taken to foster innovation in the defence sector as well, including the Innovation for Defence Excellence (iDEX) scheme, among others. In the current budget, the iDEX scheme has been allocated Rs 116 crores, representing an increase of 93 per cent over 2022–23 (BE).5
Source: Based on data from Union Budget, Ministry of Finance, Government of India, Various Years.
As per the Global Innovation Index 2022, India spends just 0.7 per cent of its GDP on R&D, and holds the 53nd rank globally, in terms of the percentage spending on R&D.6 The decision to earmark at least 25 per cent of the defence R&D budget to the private sector, start-ups and academia in the 2022–23 defence budget was a significant step. A higher R&D spend will no doubt help in developing cutting-edge products that will not only find favour with the Indian armed forces but also open up export markets for the industry.
Views expressed are of the author and do not necessarily reflect the views of the Manohar Parrikar IDSA or of the Government of India.
- 1. “Union Budget”, Ministry of Finance, Government of India.
- 2. Modernisation budget relates to capital outlay on aircrafts and aero-engines, heavy and medium vehicles, rolling stock, Rashtriya Rifles (Army); aircrafts and aero-engines, heavy and medium vehicles, Naval Fleet, Naval Dockyard/Projects, Joint Staff and Other equipment (Navy); and aircrafts and aero-engines, heavy and medium vehicles and other equipment (Air Force).
- 3. “Chapter II: Defence and Internal Security”, Report of Fifteenth Finance Commission for 2021–26, Volume 1, Main Report, October 2020, p. 340.
- 4. “Defence Gets Rs 5.94 lakh crore in Budget 2023-24, a Jump of 13% Over Previous Year”, Press Information Bureau, Ministry of Defence, Government of India, 1 February 2023.
- 5. Ibid.
- 6. “GII 2022 Economy profiles: India”, Global Innovation Index 2022, p. 142.