You are here
Defence Budget under stress: Can 2018-19 be the catalyst for change?

 A reply to a very important question raised by an Honourable member of the Rajya Sabha was listed for January 1, 2018. The question sought:
- Whether it is a fact that the military expenditure as a percentage of Gross Domestic Product (GDP) has reduced over a period of time, if so, the details thereof and the reasons therefor;
- Whether India is not spending proportionately on operations and maintenance of military equipment and development of defence infrastructure; and
- If so, the reasons therefor along with the details of the funds allocated for modernisation and equipment during the last three years?
While the reply tabled1 is in true ‘ashvatthaama hatohatah, naro va kunjarova’ (‘Aswhatama is dead, I don’t know if it is man or elephant’) style of the story in the epic of the Mahabharata, the issues raised by the question need to be examined in detail.
Indian Defence Expenditure: Facts
The need for a parliamentary question obviously arose as the details of the information sought in that question are not placed in the public domain by the Ministry of Defence (MoD). The North Atlantic Treaty Organisation (NATO) and the European Defence Agency (EDA) place in public domain an annual report with the following information in respect of each of their members.
| Table 1 | ||
|
NATO
|
EDA
|
|
The member states also place this information in the public domain but there may be differences in the figures reported due to difference in definitions or categories for reporting.
Definition
Till 2016-17, the end of the 12th plan period, defence expenditure was classified as Non-plan expenditure. The amount allocated both under the capital and the revenue budget was reflected in the Budget Statement-Expenditure (or Non plan Expenditure) under broad categories. This included the demand for the Army (including Inspection Organisation, ECHS, Military farms, Rashtriya Rifles & NCC), Navy (including Joint Staff), Air Force, DRDO and OFB for the revenue budget and one demand for the capital budget that included the three services and all the other entities whose revenue demand was included in the Army or Navy revenue budget as well as DRDO & OFB.
Table No 102 of Reserve Bank of India - Handbook of Statistics on Indian Economy, released on September 15, 2017, adopts the same even for budget of 2017-18, despite the fact that as part of rationalisation, ECHS and Military farms are now part of MoD (Civil estimates). For the purposes of this paper and like-to-like comparison, the same has been followed.
The factual information collated from different government websites is presented below:

Source: Defence Expenditure figures RBI Publications. Table No 102 of RBI Major Heads of Expenditure of the Central Government. https://rbi.org.in/scripts/PublicationsView.aspx?id=17877
GDP: Figures for 07-08 to 10-11 as per table No A 13 Economic Survey 16-17 Vol II. Figures for 11-12 to 15-16 as per Statement 1.1: Key aggregates of national accounts. National Accounts Statistics – 2017 http://www.mospi.gov.in/publication/national-accounts-statistics-2017-1 and GDP figures for 16-17 & 17-18 as per Press Note-First Advance Estimate of National Income 2017-18 http://mospi.nic.in/press-release/first-advance-estimate-national-income...
Some analysts hold the view that since GDP does not represent the amount of resources available with the government to spend, a better parameter could be the relationship of defence expenditure with the Central Government Expenditure (CGE) as that represents the resources that the government is in a position to generate, including deficit permissible by the Fiscal Responsibility and Budget Management (FRBM) Act.
Fig 2 below presents the defence expenditure as a percentage of the CGE as also the individual relationship of the revenue and the capital components.

Source: Defence Expenditure figures and CGE figures as per RBI Publications. Table No 102 of RBI Major Heads of Expenditure of the Central Government. https://rbi.org.in/scripts/PublicationsView.aspx?id=17877
The above noticed reduction in the share of defence expenditure was expected to happen:
- The share had gone up in 2008-09 and 2009-10 as 6th CPC arrears due from January 1, 2006 were paid in two instalments in these two years.
- Defence budget as a percentage of GDP was planned to reduce during the 12th Plan. Planning commission in its approach paper to the 12th Plan had stated, “Defence expenditure is projected to fall from 1.83 per cent of GDP in the base year to 1.56 per cent of GDP in the final year.”
- It was realised in 2015-16 that, $3 billion which had been earlier remitted, was lying in an account in the US. The money was paid in the Pentagon-managed account for weapon platforms and equipment that MoD was buying under the Foreign Military Sales (FMS) programme. Out of this account, the Pentagon procures equipment on behalf of foreign governments from US vendors. Major part of this amount would have been adjusted against contractual obligations on account of FMS contracts in the last 3 years.
- The 14th Finance Commission, in its February 2015 report in respect of defence revenue expenditure, had stated the following:
“Recognizing that revenue expenditure is critical for defence preparedness and maintenance, we have kept the defence revenue expenditure-GDP ratio constant during our projection period, instead of allowing growth to decelerate as was the case in the past. In other words, the rate of defence revenue expenditure has been allowed to increase at the same rate as the GDP, which is substantially higher than the past growth of defence revenue expenditure.”
In addition to the above, it is incumbent upon the government in an annual budget environment to review all major expenditure categories and find room to address the new emerging requirements, social as well as infrastructure sector needs.
Budget Allocation and Actual Expenditure
When the Union budget is presented in Parliament and passed for the financial year, it’s called the Budget estimates (BE). Let us first see what was the amount initially allocated and what was actually spent (RE for 16-17).

Source: Union budget document and DSE Vol I
The above brings out that capital budget, in all years except one, i.e. 2010-11, the funds initially allocated were not fully utilised (The expenditure in 10-11 exceeded the BE by about Rs 2000 crores). But in the case of revenue budget, only in two years was the actual expenditure lesser than the BE allocated. This was in 12-13, the first year when FRBM Act which had been suspended, was once again implemented; at the RE stage, Rs. 4903 crores was reduced from allocation; and in 15-16 when the actual expenditure exceeded the RE by Rs. 2351 crores; substantial fall in petroleum prices in 15-16 was the cause). Since both were part of non-plan expenditure till 16-17, if one was to take the total of both revenue and capital, only in four years, 08-09 to 11-12 (6th CPC arrears were paid in 08-09 & 09-10) was the actual expenditure more than the BE. This needs to be borne in mind because from here on, the paper will focus on actual expenditure.
The revenue and capital expenditure of the Army (net), Navy (net) and Air Force over the above 11-year period (07-08 to 17-18) constitutes 87.24 per cent and 90.55 per cent respectively. In the case of the Army and Navy, further analysis will be confined to the Army (excluding the Inspection organisation, Rashtriya Rifles (RR), NCC and ECHS & Military Farms), Navy (excluding the ‘Joint Staff’ i.e. HQ IDS and the Strategic Forces Command (SFC), Andaman and Nicobar Command and Tri Service training establishments).
Not spending proportionately on operations and maintenance of military equipment
Operations & Maintenance
Operations and maintenance is the key to preparation, skilling and morale of the defence services and readiness to successfully face an eventuality that the nation may be confronted with. This is achieved through rigorous training during peacetime, individual, formation, single service and joint services exercises, preparation of future leadership — both officers and personnel below officer ranks (PBORs) through in-service courses, both at service-specific and inter-services establishments, joint exercises with friendly foreign countries and subscription on regular basis at officers training establishments in other countries.
Weapon system and platforms are extreme machines and are put through their paces to the limits of their envelope during the regular training. These weapon systems and platforms consume resources in the form of fuel and ammunition during such regular training and require both preventive (after prescribed exploitation) and curative maintenance. Maintenance echelons at operator (O level) and inspection (I level) are organic. Facilities for major repairs and overhaul could be either organic or through DPSUs/OFB and some sent to OEMs. The cost of all these activities is met through the revenue budget.
Revenue expenditure is broadly grouped under five heads i.e. Pay and Allowances, Transportation (both movement of personnel and stores), Stores, Repair & Refits (only for Navy), Works (repair, upkeep & maintenance of buildings) and Miscellaneous. Stores, transportation and Repair and refits (only for Navy) constitute what NATO & EDA classify as ‘Operations and Maintenance’ (O and M).
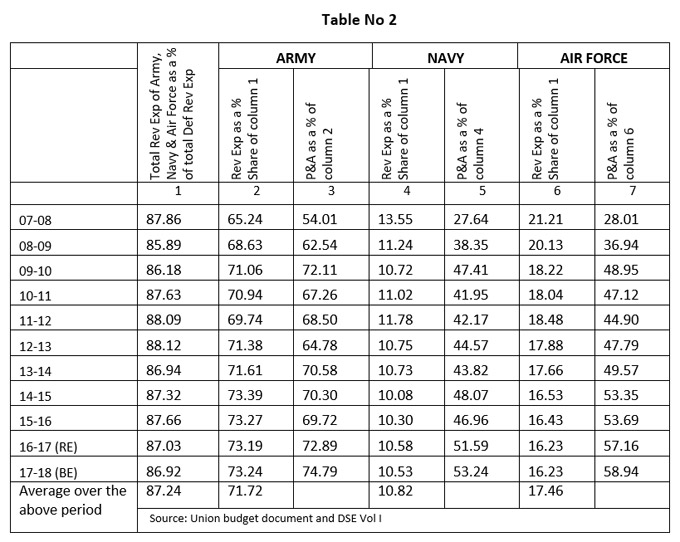
It would be seen from the above table that the share of expenditure under Pay and Allowances has increased substantially from the base year and the increase is first in 08-09 and 09-10 and thereafter in 16-17 and 17-18. This is on account of the implementation of the 6th and the 7th CPC. Pay and Allowances have the first charge on the revenue budget and the balance can only be distributed to the other four heads. The increase in the absolute amount of revenue expenditure in comparison of the year 07-08 and BE 17-18 has been 302 per cent, 204 per cent and 208 per cent respectively for the Army, Navy and Air Force. The comparative increase in the Pay and Allowances expenditure is 499 per cent, 481 per cent and 517 per cent respectively.
This has resulted in reducing the share for O and M expenditure. That most of these platforms are acquired either from Foreign OEMs or license produced in the country by DPSUs/OFB have had adverse financial implications that are common and stated under military equipment. This also has implications of long repair/overhaul time, long provisioning and procurement cycles and having to carry a large diverse inventory of spares, training of personnel and major repair and overhaul infrastructure.
Military Equipment
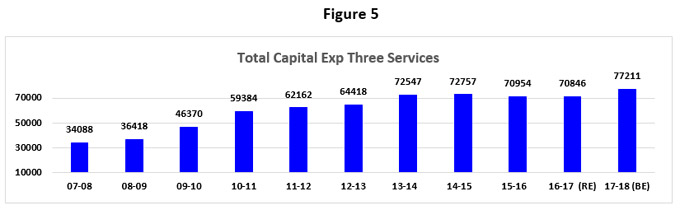
Weapon systems, platforms, guns, heavy vehicles, aircraft, ships, submarines, surveillance radars etc., are all acquired through the capital budget. This expenditure is commonly referred to as ‘Modernisation Expenditure’. The capital budget also caters for purchase of land and construction works. Except in 2010-11, the BE in capital Budget hasn't been fully utilised. Service specific trend is presented in Fig 4 below:

Source: Union Budget document and DSE Vol I
The Army has not been able to fully utilise the BE except in 07-08, the Navy and Air Force are only marginally better. The average share of expenditure on ‘land and capital works’ during the period is 10.13 per cent of the capital expenditure and the share of Army, Navy and Air Force for expenditure on land and construction works has been 68.33, 9.05 and 22.62 per cent respectively. Modernisation expenditure average share is 89.87 per cent of the capital expenditure and the Army, Navy and Air Force share has been 27.61, 27.11 and 45.21 per cent, respectively.
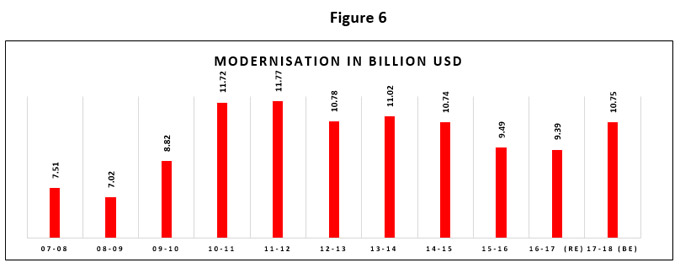
Import of weapon systems to meet our major requirement and dependence on imported material, both in license manufacture and indigenously designed systems, adds the rupee exchange rate to the dimension. The adverse movement of the rupee exchange rate reduces the purchasing power of the modernisation expenditure. Modernisation expenditure (89.87 per cent of capital budget), when converted using the annual average exchange rate of the rupee as per RBI, gives us a picture of modernisation expenditure in USD Billions in Fig 6 below.
Modernisation is a continuous on-going process. Old and vintage platforms become a drain on the maintenance and need to be replaced both to upgrade capability, technology and to keep abreast with the potential threats. Defence acquisition is a complex long drawn process and the time gap between the Acceptance of Necessity (AoN) and the contract signing could be over 15 years, as in the case of the Medium Multi Role Combat Aircraft (MMRCA).
| A case to procure 126 Mirage-2000 aircraft was initiated in the year 2000 | Later converted to procurement of 126 Medium Multi Role Combat Aircraft | Request For Proposal (RFP) was issued in 2007 |
| Only two out of the six vendors were found to be fully compliant. Bids of EADS and Dassault Aviation (DA) were opened and negotiations were commenced with DA as the L1 vendor in November 2011. | Contract negotiations had reached an impasse and the RFP was formally withdrawn on 24th June, 2015 | IGA for 36 Rafael aircraft to meet the ‘Critical Operational Necessity’ of the IAF was signed on 23rdSeptember 2016 between the Government of India and French Republic. |
Source: Reply to Unstarred Rajya Sabha Question No.173 on December 18, 2017
There is a lead-time between contract and deliveries that again are spread over a number of years depending upon the number. The personnel have to be trained to operate these platforms and acquire proficiency before the formation is equipped with the same becomes operational. Loss of momentum due to paucity of fund availability affects the capability building adversely. The resources available have been adversely affected due to recent policy decisions:
- Withdrawal of excise duty exemptions available to Ordnance Factories (OFB) and DPSUs for supplies to Defence Services (2015-16).
- Withdrawal of exemptions from CVD (Countervailing duty), SAD (Special Additional Duty) for DPSUs and OFB and primary contractors of the Ministry of Defence (2015-16).
- Withdrawal of exemption from custom duty of direct import by the Ministry of Defence (2016-17)
The objective of these exemptions was to provide a level-playing field to the domestic private sector industry and encourage setting up of a vibrant defence industrial base in the private sector. In the immediate term, it has had the effect of increasing the price of all products, whether delivered by DPSUs/OFB or Foreign OEMs. This has also adversely impacted the maintenance cost ex DPSUs/OFB and organic facilities.
Defence infrastructure
Creation of infrastructure is funded through capital budget and maintenance of infrastructure is funded through revenue budget. The share of the expenditure on land and construction work is 10.13 per cent of the capital expenditure of the Army, Navy and Air Force. If we use this across the full capital budget and add the share of revenue works budget as given in Table No 7 below, we find that the share of expenditure on infrastructure, which was 9.65 per cent of defence expenditure, is down to 8.35 per cent, a reduction of 13.5 per cent.
Expenditure Management
While full utilisation of the capital budget has been a problem till 2015-16 (fig 3 above refers), things seem to have turned a corner with expenditure under both the revenue and capital expenditure exceeding the BE in 2016-17.
| BE 16-17 | Actual 16-17 | |
| Defence Services (Revenue) | 143869 | 146633 |
| Defence Services (Capital) | 78587 | 78732 |
| Source: Union Budget document for BE and Provisional actual expenditure as per CGA website. Note: The demands of Inspection Organisation, ECHS, Military farms, Rashtriya Rifles & NCC were not included in these demands in the budget of 2016-17 |
||
It could be because of any one or both of the following reasons:
- The funds allotted were inadequate/just adequate and the milestones for stage payments due for the committed liabilities (of contracts signed in the past) were achieved and payments released.
- Acquisition management and expenditure management have improved.
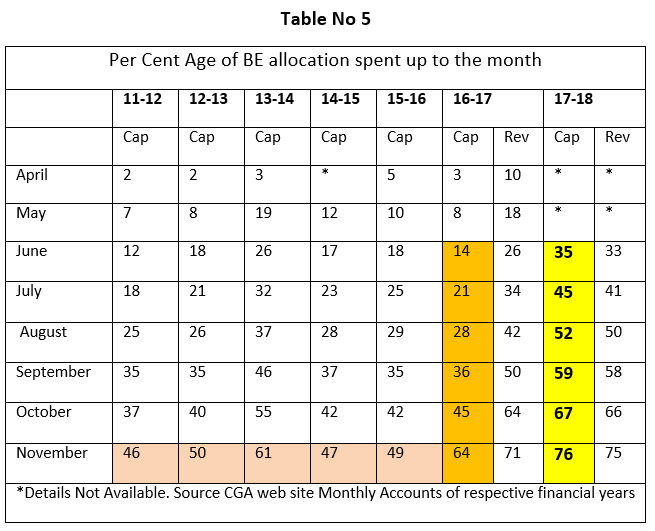
It’s a very encouraging sign that the improvement seen in 2016-17 was not an isolated case and the expenditure trend in 2017-18 is even better than last year. Revenue expenditure has always been fairly evenly spread out, as a major part of the revenue budget is for pay and allowances. It may be seen in Table No 5 below that month on month, the extent of utilisation of the BE in respect of capital budget has been substantially higher than in the past and is even better than last year.
Defence budget under stress
Capital budget
The reason for good trend in capital budget could be either or both given in sub para (a) to (b) above or pre-poning the budget presentation and possibility of utilisation for new schemes from the first day of the financial year could be the catalyst. But what has been reported in 36th report of the Parliament Standing Committee on Defence (tabulated in Table No 6 below) suggests that the capital budget is under stress in 2017-18 and similar was the case in 2016-17. It appears that the allocations are meant to cater only for committed liabilities.
| Projection | BE | Allocation as a % of projections | Allocation for 'New Schemes) | |
| Total | 146155.54 | 86,528.65 | 59.20 | MoD did not provide reply to the query of the Committee regarding details of budget provided for committed liability and new schemes for the various Defence Services for 2017-18.(Para 1.31 of the 31st report of the Parliament Standing Committee on Defence) |
| Army | 42485.93 | 25,246.35 | 59.42 | |
| Navy | 27546.49 | 18,603.71 | 67.54 | |
| Air Force | 62048.85 | 33,570.17 | 54.10 | |
| Others* | 14074.27 | 9108.42 | 64.72 | |
| *DRDO, NCC, ECHS, Military Farms, Rashtriya Rifles and DGQA. Source: 36th report of the parliament standing Committee on defence presented in Dec 2017 | ||||
Revenue Budget
The stress is not only confined to capital budget, but the table below clearly brings out the reduction in the share of ‘Stores and Equipment’ and transportation, both of which impact ‘Operations and Maintenance’, has gone down substantially compared to 2007-08 with adverse impact on training and serviceability.

As has been seen in Table No 2 above, a major factor contributing to the change in share has been the 6th and the 7th Central Pay Commission, but there has been change in number of personnel also during this period (Table No 8 below refers)

Will Budget 2018-19 relieve the stress?
Medium Term Expenditure Framework (MTEF) Statement setting forth a three-year rolling target for the expenditure was laid in both Houses of Parliament on August 10, 2017.2 This was followed up by the issuing of budget circular 2018-19 by Ministry of Finance (MoF) on September 13, 2017.3 The circular mentions that the MTEF ceilings and preparation of Detail Demand for Grants (DDGs) linkages to the overall fiscal management cannot be overemphasized, thus implying that the government’s commitment to adhere to the FRBM Act target for fiscal deficit and that the projection by the respective ministries must adhere to the ceiling in the MTEF statement. While the MTEF statement provides only two figures for Defence, one for revenue and the other for capital, they include both the Defence Service estimates and the MoD Misc. (Civil Estimates). The budget circular has disaggregated the figures to specific demand nos and the figures are:
| Name |
BE 2017-18 |
Projections 2018-19 | Projections 2019-20 | ||||
| Revenue | Capital | Revenue | Capital | Revenue | Capital | ||
| 20 | Defence Services (Revenue) | 172773.89 | 190924.26 | 207196.83 | |||
| 21 | Defence Services (Capital) | 86488.01 | 95136.81 | 104973 | |||
If these really turn out to be the allocation figures, when the budget is presented on February 1, 2018, then the stress on defence budget built up over the last two years will get compounded. If the allocation of last two years was insufficient and there are carried forward liabilities to be discharged, mere 10 per cent increase over last year would be grossly insufficient. This will be because:
- The impact of the custom duty on direct imports will be realised at the time of deliveries that begin 2018-19. The impact of this could be 18.5 to 29.74 per cent of the price.
- Similarly, the delivery of major platforms, which used material imported by DPSUs, OFB and domestic industry from 15-16, will begin to attract custom duty from this year.
- Petrol, Diesel and ATF are major consumption items and the world crude prices trend would add to the burden.
Way forward
Given that the resources (financial input) are a binding constraint, the only way to increase output is better productivity. Gen V.P. Malik in an interview to The Tribune published on August 5, 2015 had said:
“The modernisation of the armed forces continues to lag behind. The existing state of weapons and equipment could be sufficient for border skirmishes, but if they escalate, which can never be ruled out, deficiencies of weapons and ammunition and the lack of modernisation will make the present day Chiefs repeat what I had said long ago — We shall fight with whatever we have.”
It is now for the leadership of the three services to introspect and review the existing structures, strengths, systems and procedures to reduce revenue expenditure. Public Private Partnership (PPP) model which enables to spread the payout over the exploitation period needs to be examined for some of the acquisition programmes.4 The institution of higher learning in the Tri-service establishment needs to be tasked to brainstorm. Individual personnel may be encouraged to send proposals which again could become the inputs for these training establishments. Innovative ways will have to be applied and existing systems, practices and procedures need to be questioned for finding the optimum solutions. This can be the only way to relieve the budget stress.
Views expressed are of the author and do not necessarily reflect the views of the IDSA or of the Government of India.
- 1. Rajya Sabha Starred Question No. 141 For 1.1.2018 http://164.100.47.4/newrsquestion/ShowQn.aspx
- 2. http://dea.gov.in/sites/default/files/MTEF%202017-18%20uploaded_english.pdf
- 3. http://dea.gov.in/sites/default/files/Budget%20Circular%202018-2019.pdf
- 4. Please refer https://idsa.in/policybrief/TheImperativeof PublicPrivatePartnership _vkaushal_031214
| Attachment | Size |
|---|---|
| 410.12 KB |